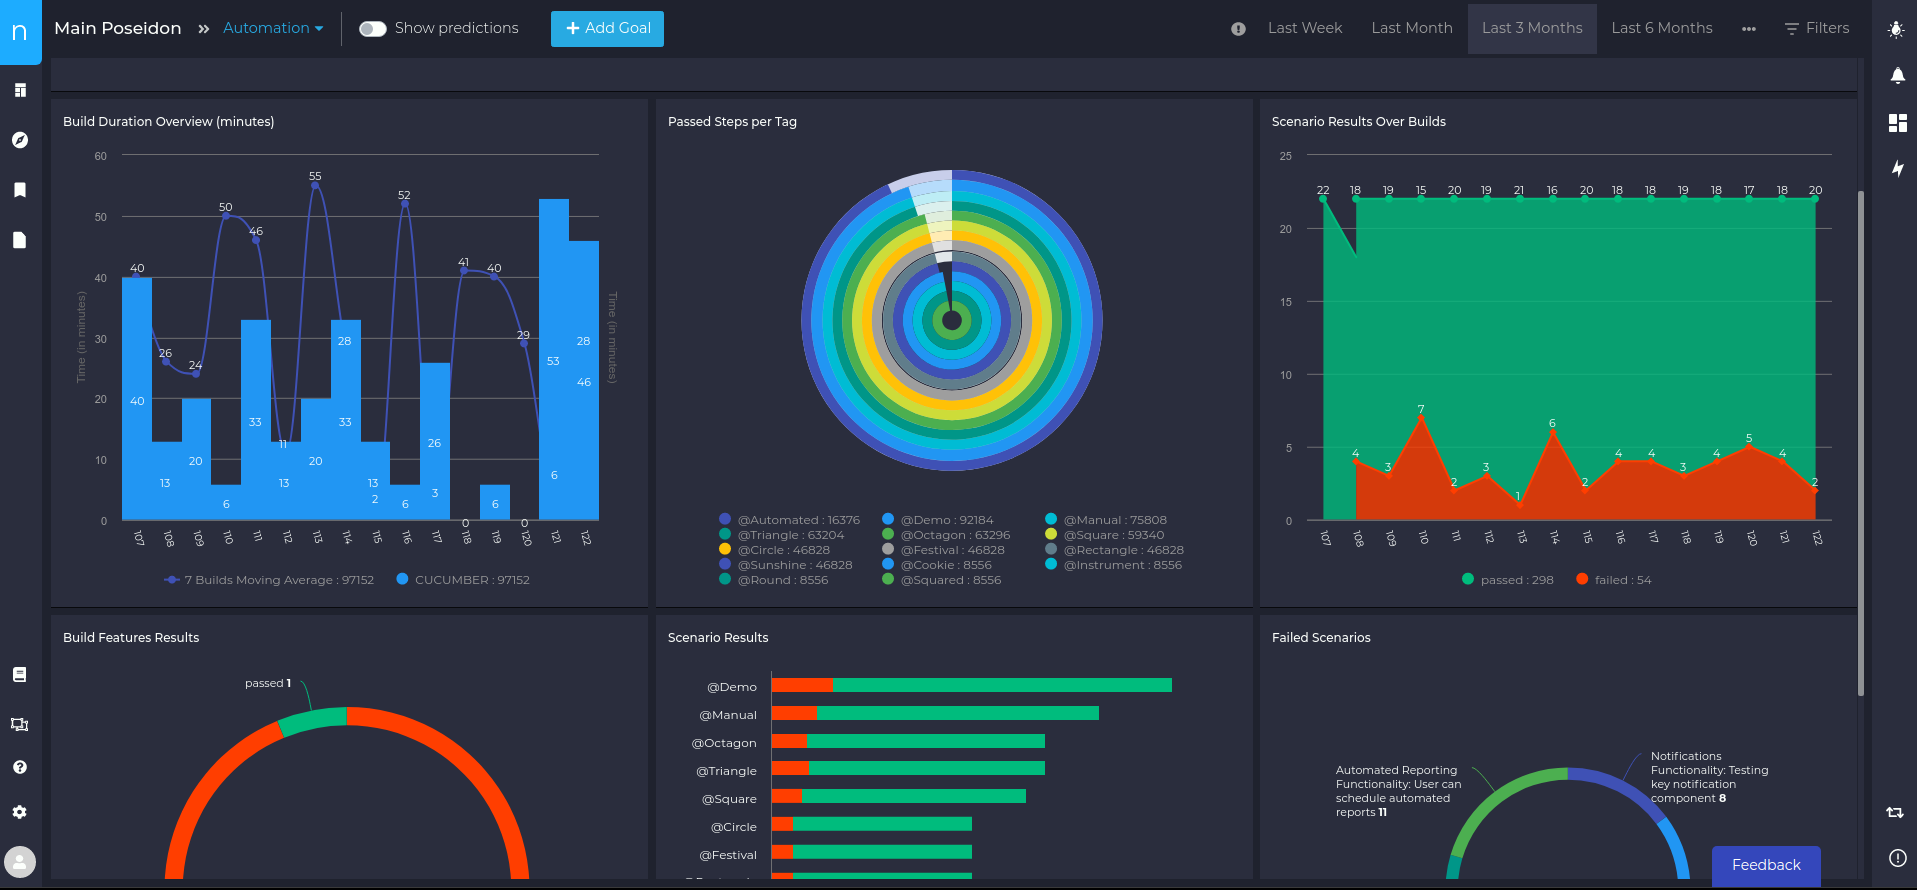
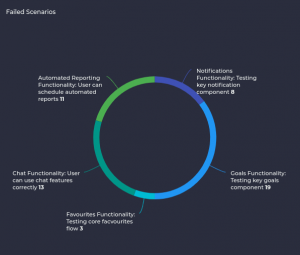
Connect to your toolchain

neuro supports multiple methods of connection from pre-built connectors to custom integrations to provide fast and complete transparency.

Cucumber Dashboard

How many of your automated testing reports do you actually see?

Test automation reports are rarely available outside of the continuous integration system, and even then they are usually poor quality.

If you install our Jenkins plugin, after each job Jenkins will send us a message with the cucumber output. We then process this automated testing data and show you cucumber reports in your test automation dashboard.

You can see the results over time, by tag, or by any other data aspect you want. You can drill-down into the charts to get more details about the tests themselves.

Test Automation Dashboards
Cucumber dashboards

Custom Dashboard

You can customise your view specifically to your requirements, then you can add charts to favourites and reports so that you can compare data across multiple Jenkins jobs or instances. 

This creates a rich test automation reporting interface that allows you to get new insights about your data. We are working on integrating new continuous integration systems and automated testing systems, so let us know what you need!

Finally, you can also add the reports to your favourites and scheduled reports, to view inline with other project data.

There’s much more you can do with

your custom dashboard

Check out the support documentation within the application.