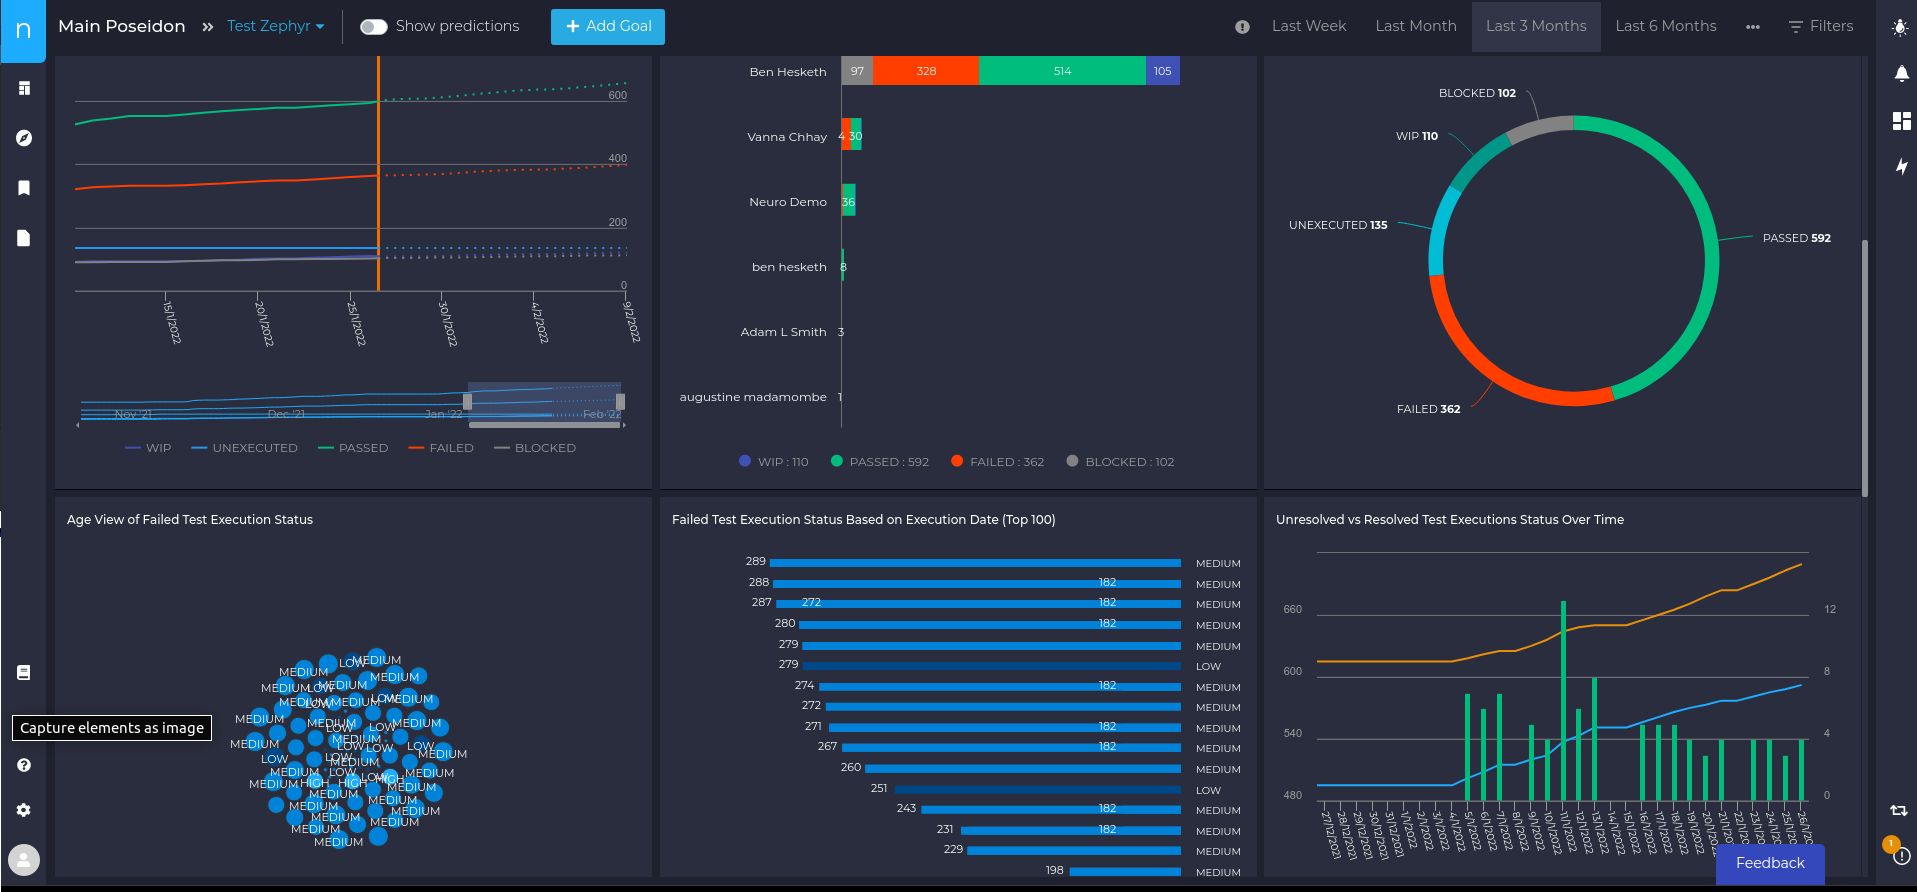
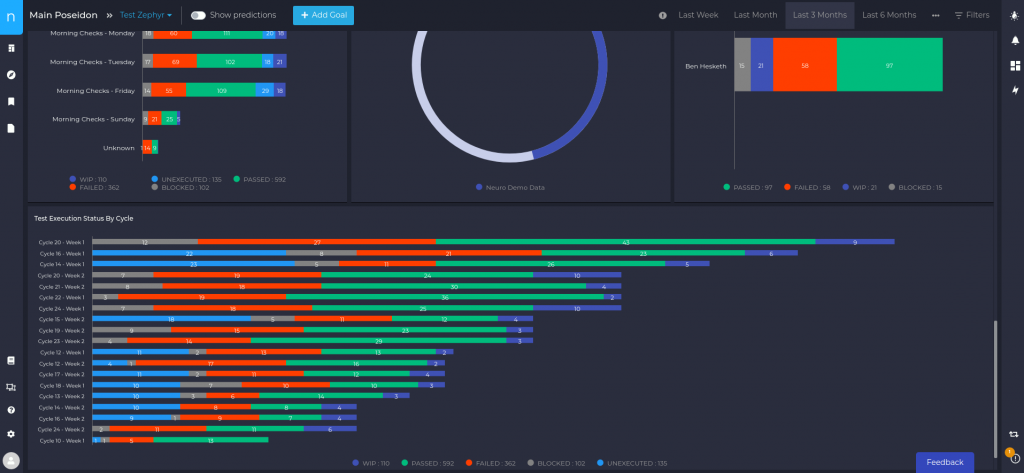
Connect to your toolchain

neuro supports multiple methods of connection from pre-built connectors to custom integrations to provide fast and complete transparency.

Zephyr and Xray Dashboard

Ever tried to get test execution metrics using native Zephyr reporting or Xray reporting? It’s not easy.

Jira reporting from plugins is much easier with neuro.

The neuro platform integrates tightly with Zephyr Squad and Xray, you can install it either from Atlassian Marketplace or directly by adding application links. We process webhooks from Jira in near real-time which gives you an up to date view of your data at all times.

Within minutes of adding a connection to Zephyr or Xray and configuring the data source.

You will see all of our base charts on your Zephyr or Xray dashboard.

Using the board centre, you can then add many more testing related charts and KPIs based on your preferences.

Testing dashboard
Zephyr Dashboard

Custom Dashboard

You can set criteria to map different statuses to different values, for example if teams are using different workflows or jira instances. We automatically sync all the important fields, but you can also add custom fields to the synchronisation.

You can customise your view specifically to your requirements, then you can add charts to favourites and reports so that you can compare data across multiple jira projects or instances. This creates a rich test execution reporting interface that allows you to get new insights about your data.

There’s much more you can do with your Zephyr dashboard or Xray dashboard – check out the support documentation within the application.

There’s much more you can do with

your custom dashboard

Check out the support documentation within the application.